yuca
How do typical glaberish and Lenia CA compare (spatial entropy)?
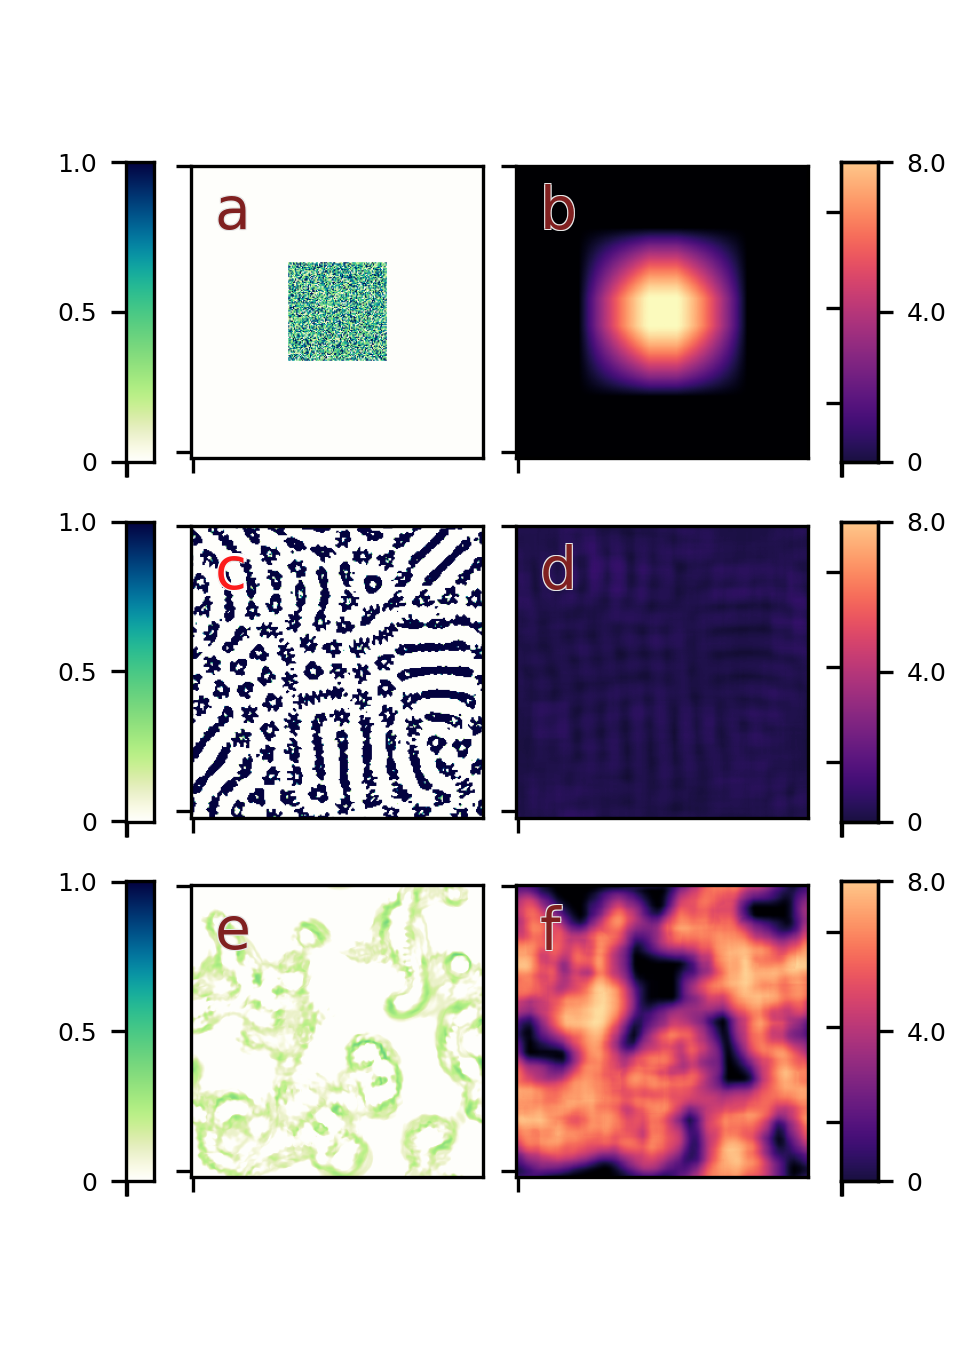
Glaberish s613 CA compared to Lenia Hydrogeminium natans CA in terms of spatial entropy maps.

Left column shows the initial state (a), Hydrogeminium after 512 time steps (c) s613 after 512 time steps (e). Right columns shows the corresponding spatial entropy maps for initial state (b), Hydrogeminium (d), and s613 (f). In 1 high entropy variance is noted as a hallmark of complexity in 1D CA, which is what we see here in s613.
-
Wuensche, A. (1999). Classifying cellular automata automatically: Finding gliders, filtering, and relating space-time patterns, attractor basins, and the Z parameter. Complexity, 4(3):47–66. ↩